Saturday, May 26, 2012

More apps, less flu?

Fewer people caught the flu this season compared with  past years. And many more apps tracking the flu have been developed.  Any relationship between these two trends?

Of course, less flu could be just the result of fewer mutations in bugs, warmer weather and more vaccinations. Yet the power of good software - such as google flu trends, twitter-based trackers and numerous apps can not be underestimated. Thanks to these tools, we are now more aware (and more afraid).

The flu is inherently social. "Nip the flu in the bud by spreading information, not germs, through the social network", says Flu Alert app. and lets you sort your friends by their flu exposures. Virtual flu in Fluville is promoting healthy habits by showing how flu can spread. Fluspotter let's you exchange warnings with your facebook friends, Flutracking reads your e-mails, while Influ takes your voice messages and shares it with users around the world. Biodisapora is tracking disease outbreaks by monitoring air travel. Sickweather scans Twitter and Facebook posts, and Germtrax lets you also sync with Foursquare and Google+  to geo-locate your wereabouts while being sick - with one of 6067 sicknesses available in their database.

According to multiple research studies, flu-related Internet searches, use of certain phrases on Twitter and Facebook posts peak 1-2 weeks earlier than the epidemic curve and align reasonably well with CDC data.

Social media is a noisy but powerful adjunct to surveillance systems based on official sources. It gives us an opportunity of contributing to the community's common good. It raises our awareness, but is not sufficient on its own. Many other factors increase our individual risks. Air travel. Or stress (haven't you noticed flu season in Greece was the worst in the world this year?) Age and food, too.

Aurametrix is a personal health analysis system that tackles this problem with an integrative approach. It aligns your medical history and historical CDC information with your food, mood and amount of sleep. It  looks at all environmental predictions for today telling you if pollen, mold spores or air quality are more likely to be the reason for your symptoms, or if it is the rise in infectious diseases in your area. Aurametrix relies on a range of official sources and social media predictions. The data are constantly updated and refined, and causes linked with effects.


REFERENCES

Dugas, A., Hsieh, Y., Levin, S., Pines, J., Mareiniss, D., Mohareb, A., Gaydos, C., Perl, T., & Rothman, R. (2012). Google Flu Trends: Correlation With Emergency Department Influenza Rates and Crowding Metrics Clinical Infectious Diseases, 54 (4), 463-469 DOI: 10.1093/cid/cir883

Manago, Adriana M., Taylor, T., Greenfield, P.M. Me and my 400 friends: The anatomy of college students' Facebook networks, their communication patterns, and well-being. (2012) Developmental Psychology, Jan 30. doi: 10.1037/a0026338

Signorini A, Segre AM, Polgreen PM. The use of Twitter to track levels of disease activity and public concern in the U.S. during the influenza A H1N1 pandemic. PLoS One. 2011 May 4;6(5):e19467. PMID: 21573238

Ginsberg J, et al. Detecting influenza epidemics using search engine query data. (2009) Nature 457, 1012–1014.

Ortiz JR, et al. Monitoring influenza activity in the United States: A comparison of traditional surveillance systems with Google Flu Trends. PLoS ONE 6(4):e18687. 2011.

Christakis NA, et al. Social network sensors for early detection of contagious outbreaks. PLoS ONE 5(9):e12948. 2010.

Malik MT, Gumel A, Thompson LH, Strome T, Mahmud SM. "Google flu trends" and emergency department triage data predicted the 2009 pandemic H1N1 waves in Manitoba. Can J Public Health. 2011 Jul-Aug;102(4):294-7. PMID: 21913587

Collier N, Son NT, Nguyen NM. OMG U got flu? Analysis of shared health messages for bio-surveillance. J Biomed Semantics. 2011 Oct 6;2 Suppl 5:S9. PMID: 22166368

Basak P. Development of an online tool for public health: the European Public Health Law Network.
Public Health. 2011 Sep;125(9):600-3. Epub 2011 Aug 23. PMID: 21864871

Chew C, Eysenbach G. Pandemics in the age of Twitter: content analysis of Tweets during the 2009 H1N1 outbreak. PLoS One. 2010 Nov 29;5(11):e14118. PMID: 21124761

Scanfeld D, Scanfeld V, Larson EL. Dissemination of health information through social networks: twitter and antibiotics. Am J Infect Control. 2010 Apr;38(3):182-8. PMID: 20347636

Eysenbach G. Infodemiology and infoveillance: framework for an emerging set of public health informatics methods to analyze search, communication and publication behavior on the Internet. J Med Internet Res. 2009 Mar 27;11(1):e11. PMID: 19329408

Sunday, March 11, 2012

Hello Summertime!.. Owls Beware


Environment can significantly affect human health. And the risks are not limited to air pollution, seasonal allergies, tainted water or chemicals in food. Our life dramas are set against the backdrop of world events that contribute to environmental health too, to a lesser or greater extent.

How does springing clocks forward affect our lives?

Hopefully, not much financially. Despite earlier predictions that average stock market returns are likely to be lower on Mondays following time changes (Kamstra et al, 2000), unbiased modeling techniques in later studies proposed that markets are not really influenced by this event (Berument et al., 2010). So we can all sleep sound tonight.

Daylight savings time (DST) will make some of us a little bit more active. By about 2%, as measured by scientists in  Indiana (Holmes et al., 2009). It will lead to a 3% drop in crime, as estimated by the Home Office in UK. So we have something to look forward to.

Still, as we are going to loose 1 hour of sleep, would it not affect our mood, our attention and the ability to work productively? Would it increase the probability of being involved in health-related catastrophes? What about traffic accidents? Some studies suggest they will increase (by 8-17% according to Stanley Coren), while others say there will be no impact or even less accidents during DST transition (if 1 day or week before is compared to 1 day/week after, see articles by Ferguson, Coate, Lahti). The results about occupational accidents and hospitalizations are also inconsistent (Janszky, Lahti).

But there was one result that scientific studies from all over the world had in common:  the impact of DST transition was different on larks and owls. And night owls were the ones that suffered the most, during spring transitions - in Finland, Germany, Korea, Russia and everywhere else.

So let's enjoy the extra hour of sunshine. And if you are a morning lark, bear with the sleepiness of night owls  - they'll need more time to adjust.

Aurametrix is an advanced analysis tool that correlates our symptoms, reactions and feelings with  environmental factors such as weather, air, pollen and time transitions.

REFERENCES

Janszky, I., Ahnve, S., Ljung, R., Mukamal, K., Gautam, S., Wallentin, L., & Stenestrand, U. (2012). Daylight saving time shifts and incidence of acute myocardial infarction – Swedish Register of Information and Knowledge About Swedish Heart Intensive Care Admissions (RIKS-HIA) Sleep Medicine, 13 (3), 237-242 DOI: 10.1016/j.sleep.2011.07.019

Lahti T, Sysi-Aho J, Haukka J, Partonen T.  Work-related accidents and daylight saving time in Finland.  Occup Med (Lond). 2011 Jan;61(1):26-8.

Morassaei S, Smith PM. Switching to Daylight Saving Time and work injuries in Ontario, Canada: 1993-2007.  Occup Environ Med. 2010 Dec;67(12):878-80. Epub 2010 Sep 30.

Lahti T, Sysi-Aho J, Haukka J, Partonen T.  Work-related accidents and daylight saving time in Finland. Occup Med (Lond). 2011 Jan;61(1):26-8. Epub 2010 Nov 15.

Lahti T, Nysten E, Haukka J, Sulander P, Partonen T. Daylight saving time transitions and road traffic accidents.  J Environ Public Health. 2010;2010:657167.

Lahti TA, Haukka J, Lönnqvist J, Partonen T. Daylight saving time transitions and hospital treatments due to accidents or manic episodes. BMC Public Health. 2008 Feb 26;8:74.

Lahti TA, Leppämäki S, Lönnqvist J, Partonen T. Transitions into and out of daylight saving time compromise sleep and the rest-activity cycles.  BMC Physiol. 2008 Feb 12;8:3.

Lahti TA, Haukka J, Lönnqvist J, Partonen T. Daylight saving time transitions and hospital treatments due to accidents or manic episodes. BMC Public Health. 2008 Feb 26;8:74.

Lim, S., Park, Y., Yang, K., & Kwon, H. (2010). Effects of Daylight Saving Time on Health Journal of Korean Medical Association, 53 (2) DOI: 10.5124/jkma.2010.53.2.155

Berument MH, Dogan N, Onar B. Effects of daylight savings time changes on stock market volatility. Psychol Rep. 2010 Apr;106(2):632-40.

Kamstra M.J., Lisa A. Kramer L.A., and Levi M.D.. The American Economic Review. Vol. 90, No. 4 (Sep., 2000), pp. 1005-1011

Holmes AM, Lindsey G, Qiu C. Ambient air conditions and variation in urban trail use.
J Urban Health. 2009 November; 86(6): 839–849.

Lofthouse N, Fristad M, Splaingard M, Kelleher K, Hayes J, Resko S. Web survey of sleep problems associated with early-onset bipolar spectrum disorders. J Pediatr Psychol. 2008 May;33(4):349-57. Epub 2008 Jan 11.

Varughese J, Allen RP. Fatal accidents following changes in daylight savings time: the American experience.
Sleep Med. 2001 Jan;2(1):31-36.

Lambe M, Cummings P. The shift to and from daylight savings time and motor vehicle crashes.
Accid Anal Prev. 2000 Jul;32(4):609-11.

Vincent A. Effects of daylight savings time on collision rates. N Engl J Med. 1998 Oct 15;339(16):1167-8.

Hicks GJ, Davis JW, Hicks RA. Fatal alcohol-related traffic crashes increase subsequent to changes to and from daylight savings time. Percept Mot Skills. 1998 Jun;86(3 Pt 1):879-82.

Coren S. Accidental death and the shift to daylight savings time. Percept Mot Skills. 1996 Dec;83(3 Pt 1):921-2.

Coren S. Daylight savings time and traffic accidents. N Engl J Med. 1996 Apr 4;334(14):924.

Ferguson SA, Preusser DF, Lund AK, Zador PL, Ulmer RG. Daylight saving time and motor vehicle crashes: the reduction in pedestrian and vehicle occupant fatalities. American Journal of Public Health. 1995;85(1):92–95.

Coren S. Daylight savings time and traffic accidents. New England Journal of Medicine. 1996;334(14):p. 924.

Coren S. Accidental death and the shift to daylight savings time. Perceptual and Motor Skills. 1996;85(3):921–922.

Coate D, Markowitz S. The effects of daylight and daylight saving time on US pedestrian fatalities and motor vehicle occupant fatalities. Accident Analysis and Prevention. 2004;36(3):351–357.

Kantermann T., Juda M., Merrow M. The human circadian clock's seasonal adjustment is disrupted by daylight saving time - Current Biology, 2007

Schneider, A., & Randler, C. (2009). Daytime sleepiness during transition into daylight saving time in adolescents: Are owls higher at risk? Sleep Medicine, 10 (9), 1047-1050 DOI: 10.1016/j.sleep.2008.08.009

Tuesday, November 8, 2011

Allergy Seasons in New Zealand

Calendar by Allergy New Zealand

New Zealand has mild temperatures, moderately high rainfall, and many hours of sunshine. The sunniest city is Tauranga, the wettest - Wellington, the driest Christchurch and the warmest city is Auckland. 
January and February are the warmest months, and July is the coldest month of the year. In summer, the average maximum temperature ranges between 20-30ºC and in winter between 10-15ºC.
New Zealand has relatively little air pollution and very strong UV rays during the summer months.
The country has a unique variety of native flora, mostly evergreen.  The introduced plants are the main source of pollen allergies. Rye is the most troublesome plant and the major cause of springtime hay fever. The pollen season starts about one month earlier at the top of the North Island than the bottom of the south Island. Pollen concentrations are slightly lower in coastal areas. Inland pastoral areas such as Hamilton and Palmerston North, can have relatively severe allergy seasons. In Auckland the main pollen season is between October and February, and  - unlike Europe and USA - is not well defined.
People of New Zealand, however, are not as affected by humidity and temperature changes as Western Europe is [1].  Similar to the rest of the world [2], prenatal and early life exposure to pollen can offer protection  against asthma, respiratory  allergy and eczema, but continued exposure may be required to maintain optimal protection [3].

1. Asher MI, Stewart AW, Mallol J, Montefort S, Lai CK, Aït-Khaled N, Odhiambo J; ISAAC Phase One Study Group. Which population level environmental factors are associated with asthma, rhinoconjunctivitis and eczema? Review of the ecological analyses of ISAAC Phase One. Respir Res. 2010 Jan 21;11:8.

2. Burr ML, Emberlin JC, Treu R, Cheng S, Pearce NE; ISAAC Phase One Study Group.
Pollen counts in relation to the prevalence of allergic rhinoconjunctivitis, asthma and atopic eczema in the International Study of Asthma and Allergies in Childhood (ISAAC). Clin Exp Allergy. 2003 Dec;33(12):1675-80.

3. Douwes J, Cheng S, Travier N, Cohet C, Niesink A, McKenzie J, Cunningham C, Le Gros G, von Mutius E, Pearce N. Farm exposure in utero may protect against asthma, hay fever and eczema. Eur Respir J. 2008 Sep;32(3):603-11. Epub 2008 Apr 30.


Wednesday, September 28, 2011

Listeria outbreak


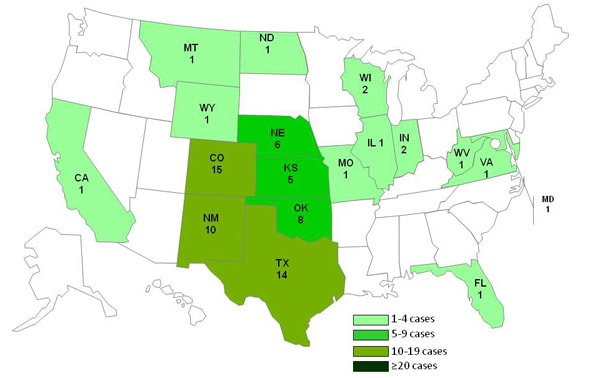
Cantaloupes have been linked to listeria in the past: in 2008 it was imported from Honduras, In March 2011 tainted cantaloupes were from Guatemala. This time the source is whole cantaloupes grown at Jensen Farms in Colorado.
According to CDC, as of September 26, 2011, a total of 72 people were reported to be infected with the four outbreak-associated strains of Listeria monocytogenes. All illnesses started on or after July 31, 2011. The number of infected persons identified in each state is as follows: California (1), Colorado (15), Florida (1), Illinois (1), Indiana (2), Kansas (5), Maryland (1), Missouri (1), Montana (1), Nebraska (6), New Mexico (10), North Dakota (1), Oklahoma (8), Texas (14), Virginia (1), West Virginia (1), Wisconsin (2), and Wyoming (1), as color-coded on the map. Thirteen deaths have been reported: 2 in Colorado, 1 in Kansas, 1 in Maryland, 1 in Missouri, 1 in Nebraska, 4 in New Mexico, 1 in Oklahoma, and 2 in Texas (shown as black circles on the upper map).
As of November 1, the number of infected people increased as follows: Alabama (1), Arkansas (1), California (2), Colorado (39), Idaho (2), Illinois (3), Indiana (3), Iowa (1), Kansas (10), Louisiana (2), Maryland (1), Missouri (6), Montana (1), Nebraska (6), Nevada (1), New Mexico (15), New York (2), North Dakota (2), Oklahoma (11), Oregon (1), Pennsylvania (1), South Dakota (1), Texas (18), Utah (1), Virginia (1), West Virginia (1), Wisconsin (2), and Wyoming (4). 

    Most people infected with Salmonella bacteria develop diarrhea, fever and abdominal cramps 12 to 72 hours after infection. The illness usually lasts 4 to 7 days, and most people recover without treatment. However, in some people, the diarrhea may be so severe that the patient needs to be hospitalized. Salmonella infection may spread from the intestines to the bloodstream, and then to other body sites and can cause death unless the person is treated promptly with antibiotics.


    Monday, September 12, 2011

    Seasonal Allergies in the British isles

    Climate in the United Kingdom is influenced by the Atlantic Ocean, and the areas closest to the ocean (Western England and Scotland, Northern island and Wales) are the mildest, wettest and windiest regions. Eastern parts of the country experience larger temperature variations, especially North East, are drier and less windy. 

    Plants native to the British Isles include Alder, Ash, Aspen, Beech, Birch , Cherry, Chestnut, Elm, Hazel, Maple and Willow. Roses. England is home to hundreds of flowers, such as sweet smelling roses with scent especially strong in the rain. Since 11th century hay meadows become commonplace, creating the abundance of flowers and grasses.

    In the Springtime the flowers as well as allergies come.

    Summer Pollen Calendar15 to 20% of the population in UK is affected by seasonal allergies, mainly related to grass pollen. It can affect ability to drive, work and study, so it should not be ignored. Mold allergies could trigger asthma - Didymelia, for example, is highest during harvesting of wheat and barley. Alternaria, Cladosporium, Aspergillus, Penicillum and Sporobolomyce can be also detected.


    Allergy forecasts can be found at many sites. Here is  one of the best ones, supported by National Pollen and Astrobiology Research unit.

    Another way to keep an eye on allergies is to listen to people - check for example, the respiratory allergies section of this UK forum.

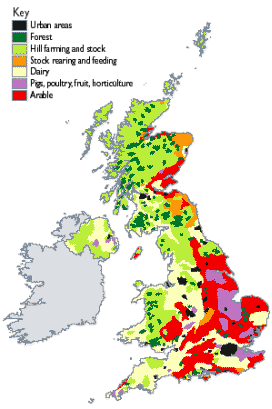
    Zirtek privided a very useful resource for allergy sufferers in UK. They author the large map above.
    Some of the things not included in this map are Cedar trees that flower from September to December
    and Chenopodium (goosefoot) that flowers during late summer. Most notable fungal allergens include Alternaria, Didymella, Cladosporium, Aspergillus, Penicillium and Sporobolomyces.

    Grass pollen map illustrates how seasonal allergies fluctuate on an annual basis. 

    Wednesday, August 31, 2011

    Flu update: May through August

      
    In May, June, July and August 2011, Influenza activity was low in North America, Europe, Northern Asia, Middle East and North Africa. Tepid latitudes of Northern hemisphere remained at baseline inter-seasonal levels.

    The 2011 influenza season in South Africa peaked in the end of June. The majority of samples were identified as 2009 H1N1 virus. Flu levels were still moderate in early July but illness activity became low by the end of July.

    Dominican Republic, Cuba, Honduras and Brazil observed moderate activity (peak was in the end of June/beginning of July). Columbia had active circulation of 2009 H1N1 virus, but there were no new cases in July and August. Illness levels in Peru and Bolivia also returned to low levels.

    Flu activity in August was low in countries of Western Africa (Ghana, Cameroon and Senegal), and Southern Asia (India, Bangladesh, Thailand, and Singapore).  Google flu trends predicted increased activity for South Africa and Chile in June-July and Uruguay in July-August. WHO data showed that flu levels returned to low in South Africa, but started to increase for Chile, Uruguay and Argentina marking the peak of the season.

    In Australia, influenza-like illness consultations and laboratory-confirmed cases continue to increase.
    The flu season started in the end of April, rates slightly declined in mid May but kept increasing since.  The most common virus was influenza A(H1N1)2009 but influenza B was also prevalent, unevenly distributed across the country.

    According to the ESR Kenepuru Science Centre and the WHO, flu incidents in New Zealand increased from mid-May through the end of July, but decreased during the first two weeks of August. ILI activity in New Zealand remained around expected levels and the majority of viruses detected have been influenza B.

    See the latest CDC  Global and WHO updates for more.

    Tuesday, August 30, 2011

    Allergy seasons in Germany

    Seasonal allergies in Germany are typical for central Europe.The Federal Office for Nature Conservation (Bundesamt für Naturschutz or BfN) divides the country into 73 geographical regions that are in three major zones: German Plain in the north, the German Upland in the central region and the German Highlands in the south. National parks of Germany are famous for their woodlands. Mueritz National Park is rich with conifer woods, oak and beech trees. Nature lovers also appreciate elm, ash, larch and birch making the country very colorful and vibrant.

    Unfortunately, these beautiful plants could also bring sneezing, wheezing, and runny nose. According to this report by BfR, around 12 % of 13-14 year-olds and 14 % (Erfurt) and 22 % (Hamburg) respectively of 20 up to 44 year old adults suffer from seasonal rhinitis or hay fever in Germany. The incidence has increased in recent years. East Germany resident are affected less than those in West Germany. Among those born from 1942 to 1951, 19.8 % (West Germany) and 11.7 % (East Germany) of people had hay fever; in the birth cohorts 1952 to 1961 the figures were 21.5 % (West) and 12.9 % (East). In the birth cohorts 1962 to 1971 the number of hay fever sufferers was as high as 26.8 % (West) and 14.7 % (East).

    Here is an approximate 2011 calendar (based on data by University of Berlin and Institute of Meteorology) showing high and lows for Hazel, Alder, Birch trees, Rye grass and other pasture grasses, and weeds such as Mugwort and Ambrosia (common ragweed widespread in North America).   
    Allergies depend on sun, wind and rain, so fluctuate every year. Compare, for example, these grass pollen data collected for 1998, 2000 and 2003 (data from the German archive).