Showing posts with label Allergy. Show all posts

Saturday, March 20, 2021

Anaphylaxis to COVID-19 vaccinies

Anaphylaxis  - severe, potentially life-threatening allergic reaction - can occur within seconds or minutes of exposure to allergens. Multiple cases of anaphylaxis have been described for COVID-19 vaccines. 

For the Pfizer/BioNTech vaccine, twenty-one anaphylaxis cases (a rate of 11.1 per million doses administered, later updated as 4.7/million from 28-million-datapoints), were documented in the US after receipt of the first dose of Pfizer-BioNTech COVID-19 vaccine during December 14–23, 2020. 17 of those had a documented history of allergies or allergic reactions, seven of whom had a history of anaphylaxis. 71% of them occurred within 15 min following the first dose of BioNTech vaccine. 

Anaphylactic shock to Pfizer vaccine happened in those with history of anaphylaxis to other vaccines (rabies and influenza A(H1N1) vaccine), drugs (prochlorperazine, antibiotics, sulfa drugs), venom (jellyfish sting) or nuts. Out of 21, 4 were allergic to sulfa drugs, 2 were allergic to nuts.

Moderna COVID-19 vaccine caused much fewer anaphylactic episodes (2.5 anaphylaxis cases per million doses administered for 27 million datapoints), but there were similarities with Pfizer cases. Out of 10 cases described in MMWR, 4 had Penicillin allergy (like 1 Pfizer case). Also, in common were allergies to sulfa drugs and azithromycin.   A Kansas woman who died 2nd day after experiencing anaphylactic reaction to her first Moderna shot, previously had an allergic reaction to Albuterol, a drug used to treat wheezing and shortness of breath.

Turner et al, 2021The Pfizer-BioNTech vaccine contains lipid nanoparticles one of which is “pegylated” (Polyethylene glycol, molecular weight 2000 Da, abbreviated to PEG2000). The Moderna mRNA vaccine also includes a different pegylated lipid (also a PEG2000). Polyethylene glycols, also known as macrogols, could be causing serious allergic reactions ins some people.

One of the culprits of anaphylaxis in Astrazeneca could be polysorbate 80, used in the formulation of protein-based biopharmaceuticals, cosmetics, skin-care products, chewing gum and foods (ice creams and puddings). 41 reports of possible anaphylaxis were seen among around 5 million vaccinations in the United Kingdom. Four cases of people potentially experiencing anaphylactic reactions within 30 minutes of receiving the AstraZeneca vaccine have been reported in Queensland and one case with fatal outcome happened in Georgia

Polysorbate 80 is also an ingredient in Johnson and Johnson vaccine. For this vaccine, no cases of anaphylaxis were reported in ~22,000 participants of phase 3 clinical trial who received it. Five patients reported developing hives within a week. There was one case of what was considered severe “a hypersensitivity reaction,” but it was reportedly not related to anaphylaxis. Last month, however, one individual in South Africa developed anaphylaxis. No details have been published yet. 

According to the CDC, polysorbate 80 is an inactive ingredient in many viral vector vaccines for influenza (Fluarid, Fluax, etc), rotavirus, shingles, Hepatitis A, Hepatitis B, HPV, and meningococcus. Polysorbate 80 is also an ingredient in COVID-19 Sputnik V vaccine from Gamaleya Research Institute.


REFERENCES

Turner PJ, Ansotegui IJ, Campbell DE, Cardona V, Ebisawa M, Yehia EG, Fineman S, Geller M, Gonzalez-Estrada A, Greenberger PA, Leung AS. COVID-19 vaccine-associated anaphylaxis: A statement of the World Allergy Organization Anaphylaxis Committee. World Allergy Organization Journal. 2021 Feb 3:100517.

Allergic Reactions Including Anaphylaxis After Receipt of the First Dose of Pfizer-BioNTech COVID-19 Vaccine — United States, December 14–23, 2020. MMWR Morb Mortal Wkly Rep 2021;70:46–51. DOI: http://dx.doi.org/10.15585/mmwr.mm7002e1external icon.

CDC COVID-19 Response Team; Food and Drug Administration. Allergic Reactions Including Anaphylaxis After Receipt of the First Dose of Moderna COVID-19 Vaccine - United States, December 21, 2020-January 10, 2021. MMWR Morb Mortal Wkly Rep. 2021 Jan 29;70(4):125-129. doi: 10.15585/mmwr.mm7004e1. PMID: 33507892; PMCID: PMC7842812.

Kounis NG, Koniari I, de Gregorio C, Velissaris D, Petalas K, Brinia A, Assimakopoulos SF, Gogos C, Kouni SN, Kounis GN, Calogiuri G. Allergic Reactions to Current Available COVID-19 Vaccinations: Pathophysiology, Causality, and Therapeutic Considerations. Vaccines. 2021 Mar;9(3):221.

Public Health England. COVID-19: the green book, chapter 14a.

Moghimi SM. Allergic Reactions and Anaphylaxis to LNP-Based COVID-19 Vaccines. Molecular Therapy. 2021 Mar 3;29(3):898-900.


Wednesday, September 11, 2013

Asthma in September

Asthma sufferers know that when it rains it spores - as fungi and mold get moving through the air. But many don't realize that the most dangerous month for children's asthma symptoms is dry September.


A study of hospital data in New York City found the spike in admissions in two to three weeks after the return to school. Additional New York studies indicated that cold and dry weather in autumn mostly increased admissions in the school-aged population (<18), while hot and dry weather in the summer caused spikes in asthma admissions across all ages. Doctor visits increase every September in many Northern Hemisphere countries. It happens in the United States, the United Kingdom, Mexico, Israel, Finland, Trinidad, and Canada, where 20% to 25% of all childhood asthma exacerbations requiring hospitalization have occurred in September.

Asthma hospitalizations in children 2-15 years in Canada


As students return to school, they are exposed to an increased number of indoor allergens, irritants and health risks. The "flu season" is approaching, weed pollen is not over yet, and indoor air is filled with pests, mold,
dust mites, animal dander, chalk
dust, cleaning agents, scented and unscented
personal care products and fumes.

So what can you do to manage asthma at school? Home environment is easier to control, but if you know your triggers, you can develop a plan - like asking teachers that pet animals with fur and feathers are not kept inside classrooms, dry-erase boards or " dustless" chalk are used instead of regular chalk and making sure that kids with asthma have reliable friends that can support them. 


REFERENCES

Sears MR, & Johnston NW (2007). Understanding the September asthma epidemic. The Journal of allergy and clinical immunology, 120 (3), 526-9 PMID: 17658590

Lin S, Jones R, Liu X, & Hwang SA (2011). Impact of the return to school on childhood asthma burden in New York State. International journal of occupational and environmental health, 17 (1), 9-16 PMID: 21344814

Lee CC, Sheridan SC, & Lin S (2012). Relating weather types to asthma-related hospital admissions in New York State. EcoHealth, 9 (4), 427-39 PMID: 23224756

Choi IS, Lee SS, Myeong E, Lee JW, Kim WJ, Jin J. (2013) Seasonal variation in skin sensitivity to aeroallergens. Allergy Asthma Immunol Res. 2013 Sep;5(5):301-8. doi: 10.4168/aair.2013.5.5.301.

Bates DV, Baker-Anderson M, Sizto R. (1990) Asthma attack periodicity: a  study of hospital emergency visits in Vancouver. Environ Res 1990; 51:51-70.

Weiss KB. Strachan D, Hansell A, Hollowell J, McNiece R, Nichols T, Anderson HR, et al. (1999) Collation and comparison of data on respiratory disease. Report to the Department of Health, August 1999.

Rosas I, McCartney HA, Payne RW, Calderon C, Lacey J, Chapela R, et al. Analysis of the relationships between environmental factors (aeroallergens, air pollution, and weather) and asthma emergency admis­sions to a hospital in Mexico City. Allergy 1998;53:394-401.

Garty BZ, Kosman E, Ganor E, Berger V, Garty L, Wietzen T, et al. Emergency room visits of asthmatic children, relation to air pollution, weather, and airborne allergens. Ann Allergy Asthma Immunol 1998; 81:563-70.

Harju T, Keistinen T, Tuuoponen T, Kivela S-L. Seasonal variation in childhood asthma hospitalizations in Finland, 1972-1992. Eur J Pediatr. 1997;156:436-9.

Monteil MA, Juman S, Hassanally R, Williams KP, Pierre L, Rahaman M, et al. Descriptive epidemiology of asthma in Trinidad, West Indies. J Asthma 2000;37:677-84.

Tuesday, August 30, 2011

Allergy seasons in Germany

Seasonal allergies in Germany are typical for central Europe.The Federal Office for Nature Conservation (Bundesamt für Naturschutz or BfN) divides the country into 73 geographical regions that are in three major zones: German Plain in the north, the German Upland in the central region and the German Highlands in the south. National parks of Germany are famous for their woodlands. Mueritz National Park is rich with conifer woods, oak and beech trees. Nature lovers also appreciate elm, ash, larch and birch making the country very colorful and vibrant.

Unfortunately, these beautiful plants could also bring sneezing, wheezing, and runny nose. According to this report by BfR, around 12 % of 13-14 year-olds and 14 % (Erfurt) and 22 % (Hamburg) respectively of 20 up to 44 year old adults suffer from seasonal rhinitis or hay fever in Germany. The incidence has increased in recent years. East Germany resident are affected less than those in West Germany. Among those born from 1942 to 1951, 19.8 % (West Germany) and 11.7 % (East Germany) of people had hay fever; in the birth cohorts 1952 to 1961 the figures were 21.5 % (West) and 12.9 % (East). In the birth cohorts 1962 to 1971 the number of hay fever sufferers was as high as 26.8 % (West) and 14.7 % (East).

Here is an approximate 2011 calendar (based on data by University of Berlin and Institute of Meteorology) showing high and lows for Hazel, Alder, Birch trees, Rye grass and other pasture grasses, and weeds such as Mugwort and Ambrosia (common ragweed widespread in North America).   
Allergies depend on sun, wind and rain, so fluctuate every year. Compare, for example, these grass pollen data collected for 1998, 2000 and 2003 (data from the German archive).

Wednesday, June 15, 2011

Allergy Seasons in Hawaii

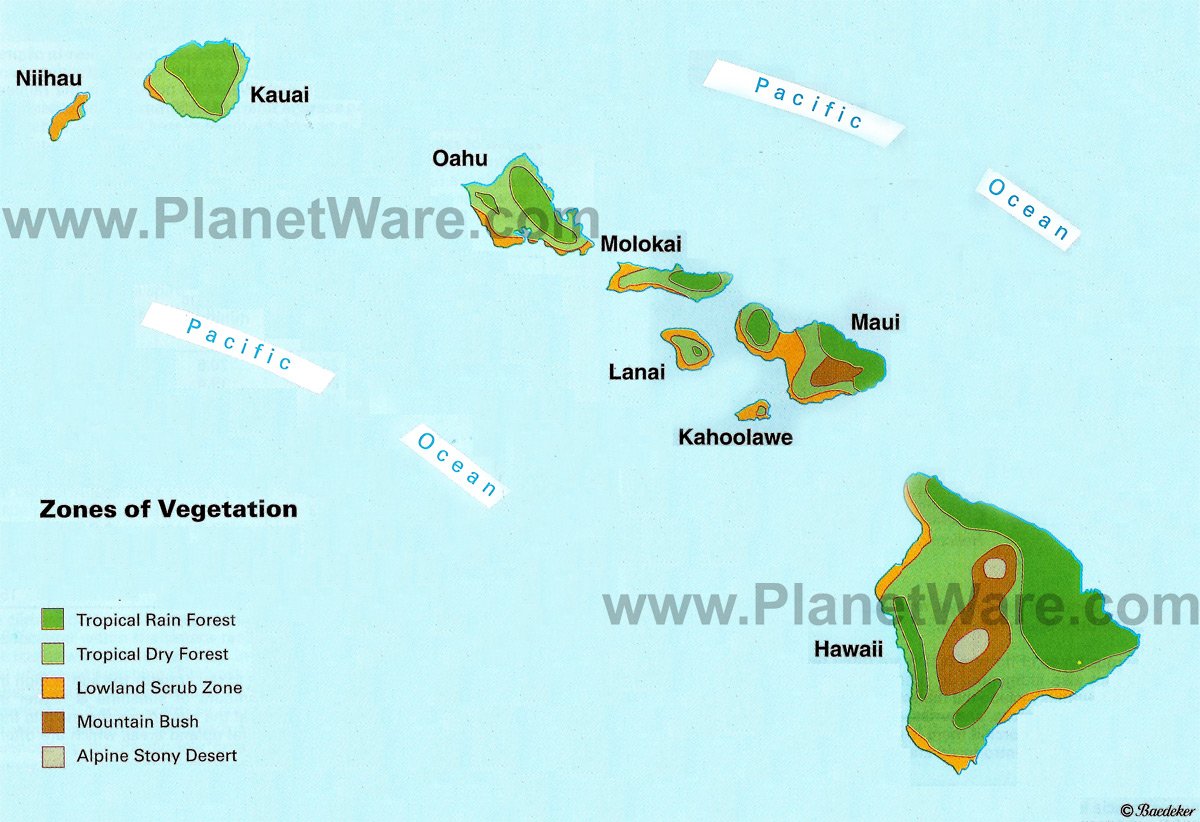
Hawaii could be a perfect place to live for people with allergies to continental trees and grasses. Yet, it has myriads of flowers and tropical trees blooming all year around. The State of Hawaii has the second highest childhood asthma rate in the nation, with 10.8% percent of children ages 0-17 diagnosed with asthma. This is mostly caused by Hawaii’s topical climate which makes for abundant vegetation, pollen, high humidity, dust mites, dust, cockroaches, and outdoor living.

One of the largest issues is outdoor mold. While in cold climates mold usually send their spores airborne from May through October, in warm and humid Hawaiian climate molds could persist throughout the year. Inhalation of mold spores could lead to sneezing, asthma, itchy and watery eyes. The symptoms may become worse for people eating cheese, mushrooms, soy sauce, dried fruits or vinegar. 

Other issues could be dust and pesticides from the cane fields. The worst months in Maui are May to November, especially mid-May to August because of the wind pattern.  Residents could also suffer from smoke coming from burning crops or garbage (combined with high winds) and polluted air due to high car traffic. Big island and Maui, to some extent Oahu, are also exposed to sulfurous odor coming from active volcanoes. Kauai is the best place for those who can't tolerate volcanic air. Yet Kauai and Hilo side of the Big Island could be the worst place for other types of pollen allergies as they have the wettest climate.  Oahu has very high mold levels too, although it could vary from place to place and depend on the exposure to indoor mold. You can check current pollen, dust and dander levels here.

See what people are saying about their experiences:  
  1. erik in honolulu
    I moved to Hawaii four months ago and my allergies have been the worst in my life since moving here. With so many flowers and fruits blooming year round, there is no relief from the pollen. Beware the rainbow state – bring allergy meds.
    I lived on Oahu for 13 years. It might just be that you were allergic to mold- that the place you were staying in had mold. Another place to stay might be fine. 
    My husband and I lived in Kihei on Maui for a year. I got what I thought was bronchitis every few months. Apparently, it was allergies. My husband was fine most of the year but mid May to mid August he was severly ill from his allergies and asthma.
    It was so bad we had to move. We would love to go back to Hawaii but do not know which areas of Hawaii are better for people with severe allergies/asthma. I have heard that Kauai and Hilo side of the Big Island are bad. Any insights into specific good or bad areas of each island would be very appreciated. — Donna, formerly in Hawaii
    1. Al Choholic
      ha , so you moved here hoping to catch a break with allergies ? :) Kihei has : 1.) basically two crowded roads , always glutted with cars ; 2.) cane growers , in tandem with Monsanto , waging chemical warfare against everyone on this island by burning their crops , which are contaminated by Monsanto ‘ s ” Franken – pesticides ” ….. not to mention the plastic piping , and various other ” miscellaneous ” items that they burn at these times ; 3.) much less than 100 miles away ( from Kihei , about 35 miles from Maui ) an active volcano . Hmmmmmm……
      I wouldn ‘ t so much call it ” allergies ” as I would call it ” polluted air ” . I ‘ m sure big cities are worse , the ones I ‘ ve been in are anyways , but Kihei is not the place to come for fresh air . If you had to be on Maui , I’ d suggest something Hana way , I ‘d LOVE to be there myself , but we ( gf and myself ) are not bohemian millionaires , nor are we locals , so nix that idea . If you have the money it ‘s the place to be …..
      unless if you have problems with mold . In which case , Kaua ‘ i , and Hilo area would be bad for you …. they both have a very wet climate , as I ‘ m sure you know Hana area has as well ( although not nearly as wet ) .
      My ” best ” suggestion for you two , I ‘ d guess something on Oahu , away from the city for sure , maybe towards North Shore , although somewhere thats not tooo wet . Oahu doesnt seem to get the vog as badly ( although they did get a spell of it around the time of the World Series last year ) as islands that are closer to Big Island …..
      by the way , your husband prob got sick between May and August because of the wind pattern at that time of the year …. pulling vog from Big Island .
      Lastly , I am a runner , moved from Minnesota , and the amount of stamina I ‘ ve lost in the year and a half that I ‘ ve been here ………wow .( And I run at night mostly. ) They burned here on Friday and now several people at work ( today is Sunday ) are sick …… I guess my points are 1.) money always tries to blame people for their ” allergies ” as they are sickening people ; 2.) there are better places out here than Kihei.
    1. Leilani Dune
      Hi:
      Kona is beautiful, but is not the place to be for asthma suffers. The State of Hawaii has failed its’ residents, as it failed to report the detrimental effects of asthma for fear of losing tourist or real estate business. As a result, our people have suffered greatly both economically and and physically.
      As a runner, and unaware of the detrimental effects of vog like conditions, I have developed a severe respiratory condition. I have never smoked, have been running since a teenager. We need to unite to make the State accountable to its’ people. Why sacrafice profit for health? ALoha, Leilani
    2. Alice Mastello
      We went to Hawaii in 1997 and I became horribly ill. I am very allergic to mold, systemically, and am afraid to go back there. Can not find out anything on mold there, but am reading the blogs and think I should continue to stay far away. Does anyone know how to find out what the mold counts are?
       
      by AllergyNurse

      I’m on Maui now. Different grasses but the Waddle trees here leave enough pollen to coat a house! Shorter season than grass though, and not quite as bad. Cost of living here is killing me instead!


      Keith
      I lived in the big Island and Oahu in the 90′s. Allergy Nurse, if you can handle the prices you might consider as a temporary fix moving to Oahu. It’s much more crowded than Maui, but I found it to be pretty good for me allergy-wise. We moved there as the mold in Hilo and the Vog in various places on the Big Island were too much for me. On Oahu I did fine. There were occasional days where I’d need to take an inhalor, but only a handful of times in a few years. You might also consider finding an environmental allergist who can help you build your immunity to allergies. These doctors are specially trained and more thorough than regular allergists. A good source for learning about this type of treatment would be to read some of Dr. Sherry Rogers’ books or google Dr. William Rea. He has a clinic in Texas and is big in the field. Not suggesting you go to Texas, but you can get the info on their site or from Rogers’ books like “Detox or Die” about how to find someone credible. Keep in mind you could have mold issues too, or even vog. You might think too of moving to the dryer part of Maui or Oahu where mold and pollen would be less. You’d still have access to the beaches, etc. Casey, the environmental allergy treatments migt help you too. I do have a friend who’s lived in Oregon for many years, he swears by the fact that no matter where in Oregon, it is very moldy and that could be what is affecting you more than the pollen. You need to be tested to see what the underlying causes are. If either of you had problems with mold or chemical sensitivities or there was something else depressing your immune system, it can manifest in greater sensitivity to allergies. Some other underlying immune issues could be: suppressed adrenals (read James Wilson’s book “Adrenal Fatigue”, underlying infections from dental cavitations or tooth, gum infections, sinus infections, use of steroids for asthma, arthritis also suppress immune function. Also having a plugged toxic liver is known as a great cause of allergies. Google “liver cleanses” and start reading about them. People have been known to get totally over allergies by doing them. Ideally you would do them under a practitioners supervision but you can do it on your own. You just need to prepare carefully and thoroughly. If any of you can find reputable alternative care that would be a big leg up to resolving some of these issues and Summer, you might some day be able to return to your beautiful home in the Hawaiian Islands. As per Arizona, I have heard very good things about it as far as being away from molds, that may be Summer what might have been aggravating your system. I hope this helps and I wish you all Aloha.

Saturday, May 7, 2011

Allergy Seasons in Alaska

Internet  offers many allergy resources for US States. Examples are pollen.com providing allergy forecasts for US zip codes and American Academy of Allergy sources of allergy levels reported by certified counting stations. Weather.com features pollen maps too.  Neither of these sites, however, tells anything about Alaska and Hawaii.

Actually Alaska's Aerobiology is similar to Northern Europe, with some tree patterns resembling northern states of US. Pollination of poplar  - food for honey bees - starts in April - as in Michigan. Birch is very high in May - as in Russia and Scandinavia. Grass is active in June and July. A core pollen season of prophylactic and clinical urgency in Fairbanks and Anchorage is defined from May 10 to June 5.

You may want to visit Anchorage Daily news site  and Anchorage Pollen and Mold Reporting or Fairbanks area report to find today' allergy information for Alaska, or check Dr. Anderson's calendar below.  It is based on the observations made for six seasons: 1982-1987, from three sample locations in Fairbanks area, but represents a good prototype for other parts of Alaska.

 
This pollen calendar shows the range of possible atmospheric pollen concentrations for late April through July, assuming the weather is relatively warm, dry, and breezy.
pollen calendar
Reference: James H. Anderson, MLIS, PhD, Institute of Arctic Biology and BioSciences Library, University of Alaska Fairbanks


Thursday, March 31, 2011

Do you have a runny nose?

Most likely this is not flu. Flu season is over in the Western Hemisphere and almost over on the East.
Google trends (on the right) show low activity in line with actual epidemiological data. As of March 20 (end of week # 11, 2011), flu activity in Europe and Russia is decreasing, and the peak is over in 38 countries of the region. Flu levels remain moderate in Armenia, Georgia, Serbia, some areas of Russia, and Ukraine where the percentage testing positive for influenza is 58%. The UK analyzed most of the viruses screened and identified 3% viruses resistant to oseltamivir but still sensitive to zanamivir.
Idaho was the last US state to get over flu in March, right after Nevada told it good bye.
Flu is almost over, but  allergies are on the rise. High pollen levels, mostly from trees, are bad news for seasonal allergy sufferers.
National Allergy Forecast Map
Tree Pollen in US in March
Knowing what is going on in your area, including flu and pollen levels, will help you to determine the reason for your scratchy throat or headaches. Additional clues include if you feel it in your nose (cold) or behind the nose (allergy), if you have itchiness (allergy) or fever (cold).

Also, flu attacks you gradually while with allergies you get all the symptoms at once. 


The EuroFlu bulletin describes and comments on influenza activity in the 53 countries in the WHO European Region. 


A = Dominant virus A
H1N1 = Dominant virus A(H1N1)
H3N2 = Dominant virus A(H3N2)
H1N2 = Dominant virus A(H1N2)
B = Dominant virus B
A & B = Dominant virus A & B

= : stable clinical activity
+ : increasing clinical activity
- : decreasing clinical activity

Low = no influenza activity or influenza at baseline levels
Medium = usual levels of influenza activity
High = higher than usual levels of influenza activity
Very high = particularly severe levels of influenza activity

No activity = no evidence of influenza virus activity (clinical activity remains at baseline levels)
Sporadic = isolated cases of laboratory confirmed influenza infection
Local outbreak = increased influenza activity in local areas (e.g. a city) within a region,
or outbreaks in two or more institutions (e.g. schools) within a region. Laboratory confirmed.
Regional activity = influenza activity above baseline levels in one or more regions with
a population comprising less than 50% of the country's total population. Laboratory confirmed.
Widespread = influenza activity above baseline levels in one or more regions with a population
comprising 50% or more of the country's population. Laboratory confirmed.


Intensity Geographic
Spread
Impact Sentinel
swabs
Percentage
positive
Dominant
type
ILI per
100,000
ARI per
100,000
Sentinel
SARI
Virology graph
and pie chart
ArmeniaMediumLocalLow20%None0.0 (graphs)106.8 (graphs)


sari
Click here
AustriaLowSporadicLow2751.9%Type A, Subtype pH1N117.9 (graphs)3.0 (graphs)
Click here
AzerbaijanLowSporadicLow190%Type A and B352.8 (graphs)


Click here
BelarusLowSporadicLow3915.4%Type A, Subtype pH1

1211.0 (graphs)
Click here
BelgiumLowSporadic


56.9 (graphs)1486.9 (graphs)
Click here
Bosnia and Herzegovina


Type A, Subtype pH1
(graphs)


Click here
BulgariaLowLocal
20%None0.0 (graphs)886.1 (graphs)
Click here
CroatiaMediumWidespreadLow

Type A, Subtype pH133.8 (graphs)


Click here
CyprusLowSporadicLow


1.9 * (graphs)4.7 * (graphs)
Click here
Czech Republic


2657.7%Type B

(graphs)
Click here
DenmarkLowSporadic
20%None66.8 (graphs)0.0 (graphs)
Click here
EnglandLowSporadic
2516.0%None7.4 (graphs)408.8 (graphs)
Click here
EstoniaMediumLocal
2825.0%None12.5 (graphs)333.6 (graphs)
Click here
FranceLowSporadicLow250%None0.0 (graphs)1213.3 (graphs)
Click here
GeorgiaMediumWidespreadModerate3287.5%Type B and Type A, Subtype pH1428.1 (graphs)


sari
Click here
GermanyLowRegional
12258.2%Type B0.0 (graphs)1085.4 (graphs)
Click here
GreeceLowLocal
1330.8%Type A, Subtype pH1N196.6 (graphs)0.0 (graphs)
Click here
HungaryLowSporadicLow1926.3%Type B and Type A, Subtype pH1102.9 (graphs)0.0 (graphs)
Click here
IcelandMediumRegionalModerate00%
56.6 (graphs)0.0 (graphs)
Click here
IrelandLowSporadicLow911.1%None5.9 (graphs)0.0 (graphs)
Click here
IsraelLowSporadicLow2114.3%Type A and B8.8 (graphs)


Click here
ItalyLowRegionalLow1926.3%Type A197.9 (graphs)0.0 (graphs)
Click here
KazakhstanMediumLocalLow5100.0%None1.4 (graphs)179.5 (graphs)


sari
Click here
Kyrgyzstan


70%None

(graphs)


sari
Click here
LatviaLowRegional
00%Type B (graphs)


Click here
LithuaniaMediumWidespreadLow100%None75.5 (graphs)777.4 (graphs)
Click here
LuxembourgLowSporadic
1421.4%Type B and Type A, Subtype pH11.0 * (graphs)20.8 * (graphs)
Click here
The former Yugoslav Republic of Macedonia


None
(graphs)


Click here
MaltaMediumSporadicLow00%
10.0 * (graphs)0 * (graphs)


sari
Click here
Montenegro


21.2 (graphs)


Click here
Netherlands


1729.4%None (graphs)


Click here
Northern IrelandLowSporadic
00%None14.4 (graphs)328.7 (graphs)
Click here
NorwayLowSporadic
1100.0%Type B and Type A, Subtype pH1N151.1 (graphs)0.0 (graphs)
Click here
PolandMediumRegional
3627.8%Type B and Type A, Subtype pH199.7 (graphs)0.0 (graphs)
Click here
PortugalLowNone
40%None6.7 (graphs)0.0 (graphs)
Click here
Republic of MoldovaMediumSporadicModerate2240.9%Type B and Type A, Subtype pH1N18.1 (graphs)229.3 (graphs)


sari
Click here
RomaniaMediumLocalModerate2441.7%Type B22.8 (graphs)1078.2 (graphs)


sari
Click here
Russian FederationMediumSporadicLow4531.1%Type A, Subtype pH15.5 (graphs)695.3 (graphs)


sari
Click here
ScotlandLowSporadicLow2516.0%Type B2.3 (graphs)242.7 (graphs)
Click here
SerbiaMediumRegionalLow1100.0%None117.3 (graphs)


sari
Click here
SlovakiaMediumSporadicLow540.0%Type A, Subtype pH1257.8 (graphs)1830.7 (graphs)
Click here
SloveniaMediumLocal
850.0%Type B and Type A, Subtype pH18.5 (graphs)1008.7 (graphs)
Click here
SpainLowSporadic
10816.7%Type B31.0 (graphs)0.0 (graphs)
Click here
SwedenMediumWidespreadLow160%Type B5.7 (graphs)0.0 (graphs)
Click here
SwitzerlandLowLocal
1163.6%Type B and Type A, Subtype pH1102.4 (graphs)


Click here
TurkeyLowSporadicLow11237.5%None6.0 (graphs)


Click here
UkraineMediumLocalLow110%Type A, Subtype pH15.2 * (graphs)624.6 (graphs)


sari
Click here
UzbekistanLowSporadicLow

None

(graphs)
Click here
Europe


91232.7%


Click here