Showing posts with label influenza-like illness. Show all posts

Saturday, December 21, 2019

Flu Season 2019-2020

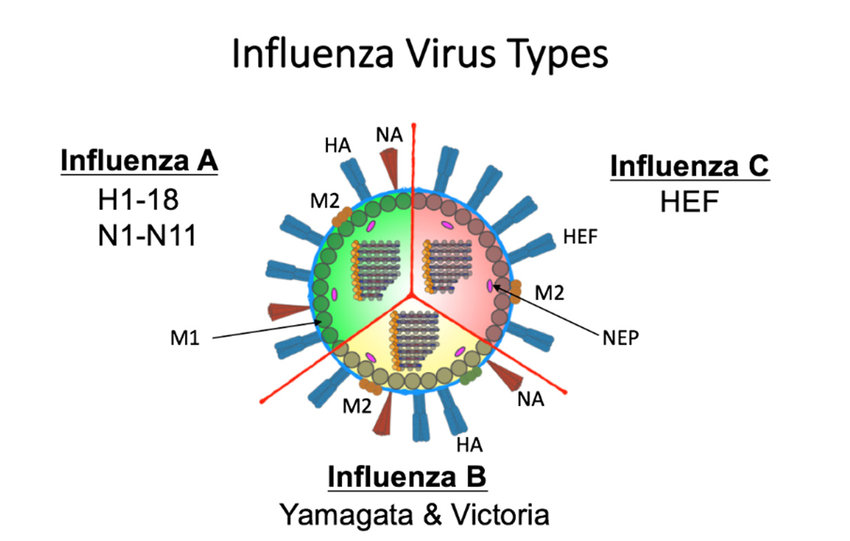
Influenza viruses are negative-sense single stranded RNA viruses of the Orthomyxoviridae family. There are four types of influenza viruses: A, B, C and D . In electron microscopy these types, especially A and B,  could be virtually indistinguishable. D is more similar to C.
Most of these viruses look like small spheres with spikes, although some could be irregularly shaped. Spikes are proteins and they are what's different in different forms of influenza. Typically, influenza A starts the early wave of the flu, and influenza B starts to show up at the tail-end of the season, in early spring. This year is't flu B that started the first wave while flu A may be responsible for the second wave. Is the flu shot working? It's still too early to predict.


Saturday, February 9, 2013

Will you get the flu this season?

Worst of flu season may be over. But you can still catch a chill. If you shake hands with lots of sick people, for example. Or don't keep sufficiently warm. Yes, your mother has told you, and you thought it was just an old wives' tale, but it wasn't. Scientists (Johnson and Eccles, 2005) provide evidence that cold exposure may induce cold symptoms without any contact to sick individuals. As we all carry dormant (sub-clinical) infections in our nose, genitals and other parts of the body, and these viruses may get reactivated. Ever noticed the need to blow nose after spending some time in cold air? Your body might be trying to expel the waking-up microbes.

Emerging health analysis software tools like Aurametrix aim at keeping us healthy by warning about symptoms and diseases. Prolonged exposure to cold means that 4-5 days after the exposure there is 10% probability of developing nasal stuffiness, sneezing, throat irritation of mild fever. 10% if Aurametrix knows nothing else about you. Higher if you are in the most vulnerable age & health conditions group, have a history of more frequent cold infections in prior years or were recently exposed to other stressors. Aurametrix can draw additional conclusions from looking at ingredients in your diet and chemicals in your environment.  Medical records could add another thousand variables. Medical codes given to every documented complaint, prior medications, procedures, information about attending doctors and payments were shown to help predict C.difficile infections in hospitals using machine learning (Wiens, Guttag, Horvitz, 2012).

Social media (in addition to notifications by official sources) keeps us more aware and more afraid of the flu. But what if we are not able to keep away from exposure to a virus, forgot to clean our hands and could not avoid a non-ventilated area with sneezing sick people? The good news is that if we did everything else right we have a fighting chance. As it was shown in a scientific study (Huang et al., 2011), only 9 out of 17 healthy human volunteers exposed to H3N2 virus developed mild to severe symptoms.

So be happy to be healthy, in addition to doing your best to stay flu-free.

Image Credits: Allison Morris, OnlineEducation.net  Flu Infographic


REFERENCES

Johnson C, & Eccles R (2005). Acute cooling of the feet and the onset of common cold symptoms. Family practice, 22 (6), 608-13 PMID: 16286463

Jankowski R, Philip G, Togias A, Naclerio R. Demonstration of bilateral cholinergic secretory response after unilateral nasal cold, dry air challenge. Rhinology 1993; 31: 97-100

J. Wiens, J. Guttag, E. Horvitz. Learning Evolving Patient Risk Processes for C. Diff ColonizationMachine Learning for Clinical Data Analysis, ICML 2012, Edinburgh, Scotland, June 2012.

Huang Y, Zaas AK, Rao A, Dobigeon N, Woolf PJ, Veldman T, Ă˜ien NC, McClain MT, Varkey JB, Nicholson B, Carin L, Kingsmore S, Woods CW, Ginsburg GS, & Hero AO 3rd (2011). Temporal dynamics of host molecular responses differentiate symptomatic and asymptomatic influenza a infection. PLoS genetics, 7 (8) PMID: 21901105

Saturday, May 26, 2012

More apps, less flu?

Fewer people caught the flu this season compared with  past years. And many more apps tracking the flu have been developed.  Any relationship between these two trends?

Of course, less flu could be just the result of fewer mutations in bugs, warmer weather and more vaccinations. Yet the power of good software - such as google flu trends, twitter-based trackers and numerous apps can not be underestimated. Thanks to these tools, we are now more aware (and more afraid).

The flu is inherently social. "Nip the flu in the bud by spreading information, not germs, through the social network", says Flu Alert app. and lets you sort your friends by their flu exposures. Virtual flu in Fluville is promoting healthy habits by showing how flu can spread. Fluspotter let's you exchange warnings with your facebook friends, Flutracking reads your e-mails, while Influ takes your voice messages and shares it with users around the world. Biodisapora is tracking disease outbreaks by monitoring air travel. Sickweather scans Twitter and Facebook posts, and Germtrax lets you also sync with Foursquare and Google+  to geo-locate your wereabouts while being sick - with one of 6067 sicknesses available in their database.

According to multiple research studies, flu-related Internet searches, use of certain phrases on Twitter and Facebook posts peak 1-2 weeks earlier than the epidemic curve and align reasonably well with CDC data.

Social media is a noisy but powerful adjunct to surveillance systems based on official sources. It gives us an opportunity of contributing to the community's common good. It raises our awareness, but is not sufficient on its own. Many other factors increase our individual risks. Air travel. Or stress (haven't you noticed flu season in Greece was the worst in the world this year?) Age and food, too.

Aurametrix is a personal health analysis system that tackles this problem with an integrative approach. It aligns your medical history and historical CDC information with your food, mood and amount of sleep. It  looks at all environmental predictions for today telling you if pollen, mold spores or air quality are more likely to be the reason for your symptoms, or if it is the rise in infectious diseases in your area. Aurametrix relies on a range of official sources and social media predictions. The data are constantly updated and refined, and causes linked with effects.


REFERENCES

Dugas, A., Hsieh, Y., Levin, S., Pines, J., Mareiniss, D., Mohareb, A., Gaydos, C., Perl, T., & Rothman, R. (2012). Google Flu Trends: Correlation With Emergency Department Influenza Rates and Crowding Metrics Clinical Infectious Diseases, 54 (4), 463-469 DOI: 10.1093/cid/cir883

Manago, Adriana M., Taylor, T., Greenfield, P.M. Me and my 400 friends: The anatomy of college students' Facebook networks, their communication patterns, and well-being. (2012) Developmental Psychology, Jan 30. doi: 10.1037/a0026338

Signorini A, Segre AM, Polgreen PM. The use of Twitter to track levels of disease activity and public concern in the U.S. during the influenza A H1N1 pandemic. PLoS One. 2011 May 4;6(5):e19467. PMID: 21573238

Ginsberg J, et al. Detecting influenza epidemics using search engine query data. (2009) Nature 457, 1012–1014.

Ortiz JR, et al. Monitoring influenza activity in the United States: A comparison of traditional surveillance systems with Google Flu Trends. PLoS ONE 6(4):e18687. 2011.

Christakis NA, et al. Social network sensors for early detection of contagious outbreaks. PLoS ONE 5(9):e12948. 2010.

Malik MT, Gumel A, Thompson LH, Strome T, Mahmud SM. "Google flu trends" and emergency department triage data predicted the 2009 pandemic H1N1 waves in Manitoba. Can J Public Health. 2011 Jul-Aug;102(4):294-7. PMID: 21913587

Collier N, Son NT, Nguyen NM. OMG U got flu? Analysis of shared health messages for bio-surveillance. J Biomed Semantics. 2011 Oct 6;2 Suppl 5:S9. PMID: 22166368

Basak P. Development of an online tool for public health: the European Public Health Law Network.
Public Health. 2011 Sep;125(9):600-3. Epub 2011 Aug 23. PMID: 21864871

Chew C, Eysenbach G. Pandemics in the age of Twitter: content analysis of Tweets during the 2009 H1N1 outbreak. PLoS One. 2010 Nov 29;5(11):e14118. PMID: 21124761

Scanfeld D, Scanfeld V, Larson EL. Dissemination of health information through social networks: twitter and antibiotics. Am J Infect Control. 2010 Apr;38(3):182-8. PMID: 20347636

Eysenbach G. Infodemiology and infoveillance: framework for an emerging set of public health informatics methods to analyze search, communication and publication behavior on the Internet. J Med Internet Res. 2009 Mar 27;11(1):e11. PMID: 19329408

Wednesday, August 31, 2011

Flu update: May through August

  
In May, June, July and August 2011, Influenza activity was low in North America, Europe, Northern Asia, Middle East and North Africa. Tepid latitudes of Northern hemisphere remained at baseline inter-seasonal levels.

The 2011 influenza season in South Africa peaked in the end of June. The majority of samples were identified as 2009 H1N1 virus. Flu levels were still moderate in early July but illness activity became low by the end of July.

Dominican Republic, Cuba, Honduras and Brazil observed moderate activity (peak was in the end of June/beginning of July). Columbia had active circulation of 2009 H1N1 virus, but there were no new cases in July and August. Illness levels in Peru and Bolivia also returned to low levels.

Flu activity in August was low in countries of Western Africa (Ghana, Cameroon and Senegal), and Southern Asia (India, Bangladesh, Thailand, and Singapore).  Google flu trends predicted increased activity for South Africa and Chile in June-July and Uruguay in July-August. WHO data showed that flu levels returned to low in South Africa, but started to increase for Chile, Uruguay and Argentina marking the peak of the season.

In Australia, influenza-like illness consultations and laboratory-confirmed cases continue to increase.
The flu season started in the end of April, rates slightly declined in mid May but kept increasing since.  The most common virus was influenza A(H1N1)2009 but influenza B was also prevalent, unevenly distributed across the country.

According to the ESR Kenepuru Science Centre and the WHO, flu incidents in New Zealand increased from mid-May through the end of July, but decreased during the first two weeks of August. ILI activity in New Zealand remained around expected levels and the majority of viruses detected have been influenza B.

See the latest CDC  Global and WHO updates for more.
Thursday, February 10, 2011

Flu Season is not over yet, but February marks the peak

As of mid February 2011, influenza activity in the United States remains elevated, but it appears to have peaked in the majority of European, North African and Middle Eastern countries.


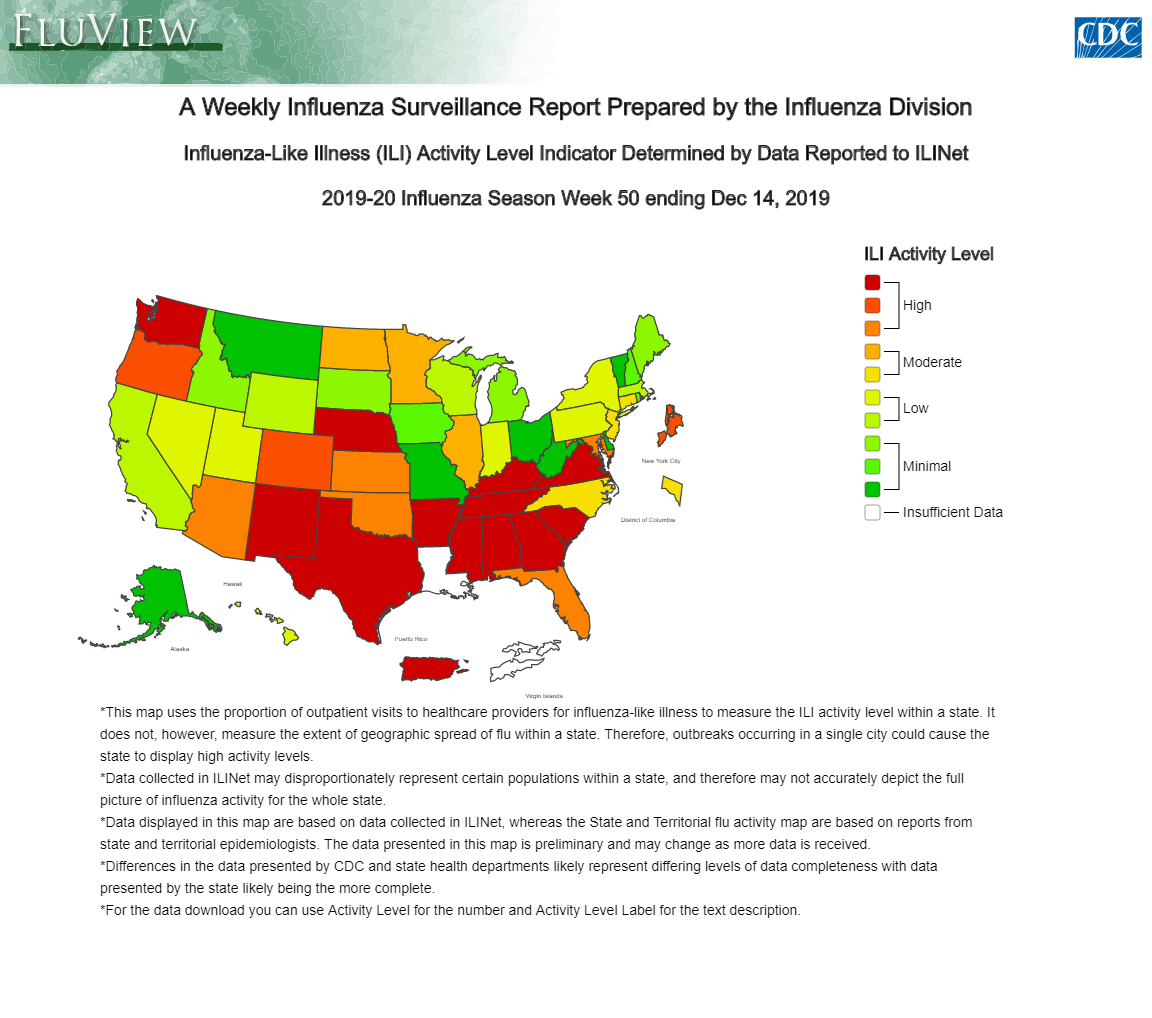
  • There were more outpatient visits for influenza-like illness (ILI): 4.5% vs the national baseline of 2.5%, it was above region-specific baseline levels in all US regions. 
    • Twenty states (Alabama, Arkansas, Colorado, Georgia, Idaho, Indiana, Louisiana, Maryland, Missouri, New Jersey, New Mexico, New York, North Carolina, Oklahoma, South Carolina, Tennessee, Texas, Utah, Virginia, and West Virginia) experienced high ILI activity.
    • Nine states (California, Florida, Hawaii, Illinois, Kansas, Kentucky, Mississippi, Pennsylvania, and Wyoming) experienced moderate ILI activity.
    • New York City and five states (Arizona, Massachusetts, Nebraska, Nevada, and Wisconsin) experienced low ILI activity.
    • Minimal ILI activity was experienced by the District of Columbia and 16 states (Alaska, Connecticut, Delaware, Iowa, Maine, Michigan, Minnesota, Montana, New Hampshire, North Dakota, Ohio, Oregon, Rhode Island, South Dakota, Vermont, and Washington).
  • The geographic spread of influenza in 37 states was reported as widespread; 10 states reported regional influenza activity; the District of Columbia reported local activity; Puerto Rico, the U.S. Virgin Islands, and three states reported sporadic influenza activity, and Guam reported no influenza activity.  

Global flu activity (see CDC page for current information), was most prominent in the tropical regions of Asia. From February, cases of respiratory disease were high in Singapore and Hong Kong, and 90% of influenza-positive samples were 2009 H1N1. Influenza activity continued to rise in southern China, where 46% of ILI specimens in Week 5 tested positive for influenza, a 3% increase from Week 4. 2009 H1N1 was the predominant subtype.

According to WHO, Madagascar reported an increase in influenza activity, with the co-circulation of influenza B and A (H3N2). There was little influenza activity reported in the tropical regions of the Americas or in sub-Saharan Africa. 


Influenza activity in the majority of North African and Middle Eastern countries appears to have peaked, except for Algeria, where flu activity increased. The percentage of influenza-positive respiratory specimens was also high in Pakistan, Iran and Oman, where 2009 H1N1 and type B viruses co-circulated in relatively equal numbers.
According to the Public Health Agency of Canada, influenza activity increased slightly in Week 5, but remained below the peak reported earlier this season. The percentage of influenza-positive respiratory samples increased from 17% in Week 4 to 19% in Week 5. Since the beginning of the influenza season, 88% of subtyped influenza A specimens have been influenza A (H3N2).
According to the China National Influenza Center, influenza activity rose in recent weeks in northern China. In Week 5, 21% of influenza-like illness (ILI) specimens were influenza-positive, and 2009 H1N1 viruses were predominant. WHO reported that Mongolia saw an increase in 2009 H1N1 virus detections, while Japan saw a sharp increase in ILI activity.
Activity in the Southern Hemisphere remained low.

In Europe, 2 countries (Georgia and Luxembourg) and the Siberian region of the Russian Federation reported very high intensity of influenza activity; 8 countries reported high intensity; 27 reported medium intensity and 4 countries, low intensity. 23 countries reported widespread activity. Of the 25 countries reporting on the impact of influenza on health care systems, 1 (Georgia) reported severe impact; 14 countries reported moderate impact and 10, low impact.

Of the 41 countries reporting on consultation rates for ILI and ARI, 8 (Albania, Belarus, the Czech Republic, Iceland, Kazakhstan, the Republic of Moldova, Serbia and Slovakia) reported increases while 6 (Ireland, Israel, Malta, Norway, Spain and the United Kingdom (England)) reported decreases. Influenza activity has apparently passed its peak in 24 countries in this region. In general, the highest consultation rates were reported for children aged 0–4 and 5–14 years.

WHO/Europe received sentinel surveillance data on hospitalized SARI cases from 9 countries (Armenia, Georgia, Kazakhstan, Kyrgyzstan, Romania, the Republic of Moldova, the Russian Federation, Serbia and Ukraine). Sentinel SARI hospitalizations are at the highest levels observed for the season so far in Georgia and Serbia. In Georgia, however, outpatient clinical consultation rates declined from week 5 to week 6, while the relative percentage of both SARI and ILI specimens testing positive for influenza B increased. Sentinel SARI hospitalizations in Kazakhstan, Kyrgyzstan, Romania and the Russian Federation have declined somewhat from observed peaks in weeks 3–5, but remain notably elevated above pre-season levels, with 30–50% of sentinel SARI specimens testing positive for influenza in each of these countries. Sentinel SARI admissions in the Republic of Moldova and Ukraine are at levels below prior peaks. Nevertheless, a significant percentage of sentinel SARI specimens continue to test positive for influenza, and the proportion of influenza A detections in sentinel SARI specimens in Ukraine increased in week 6. Further information on the sentinel SARI surveillance systems represented in the EuroFlu bulletin can be found in the “Overview of sentinel SARI systems in EuroFlu”.


Table and graphs (Europe)


IntensityGeographic
Spread
ImpactSentinel
swabs
Percentage
positive
Dominant
type
ILI per
100,000
ARI per
100,000
Sentinel
SARI
Virology graph
and pie chart
AlbaniaHighLocalModerate7816.7%Type A, Subtype pH1 and H3503.6(graphs)Click here
ArmeniaMediumLocalModerate333.3%None0.0(graphs)81.4(graphs)

sari
Click here
AustriaMediumNoneLow7068.6%Type A, Subtype pH1N10.0(graphs)33.2(graphs)Click here
AzerbaijanLowSporadicLow170%None292.7(graphs)Click here
BelarusMediumLocalModerate3330.3%Type A, Subtype pH11938.6(graphs)Click here
BelgiumMediumWidespread5362.3%Type B and Type A, Subtype pH1391.1(graphs)1695.1(graphs)Click here
Bosnia and HerzegovinaType A, Subtype pH1(graphs)Click here
BulgariaMediumRegional1428.6%Type A, Subtype pH10.0(graphs)1439.3(graphs)Click here
CroatiaHighWidespreadLowType A, Subtype pH1186.6(graphs)Click here
Czech RepublicMediumWidespread2975.9%Type B and Type A, Subtype pH1N1296.7(graphs)1583.2(graphs)Click here
DenmarkMediumWidespread5125.5%None(graphs)0.0(graphs)Click here
EnglandLowSporadic13711.7%Type A and B18.4(graphs)424.7(graphs)Click here
EstoniaMediumWidespread5534.6%Type A, Subtype pH1N123.1(graphs)502.3(graphs)Click here
FinlandWidespread6271.0%Type B and Type A, Subtype pH10.0(graphs)0.0(graphs)Click here
FranceMediumWidespreadLow23241.4%Type B and Type A, Subtype pH1N10.0(graphs)2824.4(graphs)Click here
GeorgiaVery HighWidespreadSevere5791.2%Type B and Type A, Subtype pH11627.6(graphs)

sari
Click here
GermanyMediumRegional30561.0%Type A, Subtype pH1N10.0(graphs)1342.3(graphs)Click here
GreeceHighWidespread1872.2%Type A, Subtype pH1N1361.0(graphs)0.0(graphs)Click here
HungaryHighWidespreadModerate1629.3%Type A, Subtype pH1587.9(graphs)0.0(graphs)Click here
IcelandMediumRegionalModerate00%57.6(graphs)0.0(graphs)Click here
IrelandMediumWidespreadLow5339.6%Type B50.3(graphs)0.0(graphs)Click here
IsraelMediumWidespreadModerate5853.5%Type A and B52.8(graphs)Click here
ItalyHighWidespreadModerate23036.5%Type A, Subtype pH1N1965.4(graphs)0.0(graphs)Click here
KazakhstanMediumLocalModerate4427.3%None3.1(graphs)422.3(graphs)

sari
Click here
KyrgyzstanLowNoneLow1435.7%Type A and B9.3(graphs)82.4(graphs)

sari
Click here
LatviaMediumWidespread2147.6%Type B and Type A, Subtype pH1(graphs)Click here
Lithuania1457.1%Type B and Type A, Subtype pH1(graphs)Click here
LuxembourgVery HighWidespread10862.0%Type B and Type A, Subtype pH110.2 *(graphs)27.9 *(graphs)Click here
The former Yugoslav Republic of MacedoniaNone(graphs)Click here
MaltaLowLocalLow00%3.6 *(graphs)0 *(graphs)Click here
NetherlandsMediumWidespread3129.0%Type B70.9(graphs)0.0(graphs)Click here
Northern IrelandLowLocalType B35.6(graphs)372.6(graphs)Click here
NorwayMediumWidespread2560.0%Type B145.8(graphs)0.0(graphs)Click here
PolandMediumRegional11429.8%Type A, Subtype pH1180.8(graphs)0.0(graphs)Click here
PortugalMediumWidespread850.0%Type A, Subtype pH150.0(graphs)0.0(graphs)Click here
Republic of MoldovaMediumLocalModerate6966.7%Type B and Type A, Subtype pH1N137.8(graphs)394.3(graphs)

sari
Click here
RomaniaMediumWidespreadModerate5545.5%Type B and Type A, Subtype pH1N193.8(graphs)2855.0(graphs)

sari
Click here
Russian FederationHighWidespreadModerate6645.5%Type A, Subtype pH157.0(graphs)1295.9(graphs)

sari
Click here
ScotlandMediumLocalLow4841.7%Type B8.9(graphs)262.1(graphs)Click here
SerbiaHighRegionalModerate2365.2%Type A, Subtype pH1N1218.2(graphs)

sari
Click here
SlovakiaMediumRegionalModerate572.5(graphs)2820.6(graphs)Click here
SloveniaMediumWidespread3982.1%Type B and Type A, Subtype pH169.6(graphs)1711.9(graphs)Click here
SpainMediumRegional34036.5%Type B152.4(graphs)0.0(graphs)Click here
SwedenHighWidespreadLow5572.7%Type B12.6(graphs)0.0(graphs)Click here
SwitzerlandMediumWidespread312.0(graphs)Click here
TurkeyMediumLocalModerate30450.0%None(graphs)Click here
UkraineMediumLocalLow1428.6%Type B and Type A, Subtype pH14.6 *(graphs)641.4(graphs)

sari
Click here
WalesLowSporadicLow8.3(graphs)0.0(graphs)Click here
Europe310944.2%Click here
Preliminary data

Intensity: Low = no influenza activity or influenza activity at baseline level; Medium= usual levels of influenza activity; High = higher than usual levels of influenza activity; Very high = particularly severe levels of influenza activity.
Percentage positive: percentage of sentinel swabs that tested positive for influenza A or B
Dominant type: this assessment is based on data from sentinel and non-sentinel sources
ARI: acute respiratory infection
ILI: influenza-like illness
Population: per 100,000 population
*: the value in the table for these countries reflects the percent (e.g. from 0.0 to 100.0) of total outpatient encounters that were due to ILI/ARI rather than a consultation rate per 100,000